Grafana & InfluxDB in Home Assistant Dasbhoard
I use the Grafana and InfluxDB Home Assistant integrations to better track and monitor all sorts of sensors and services.
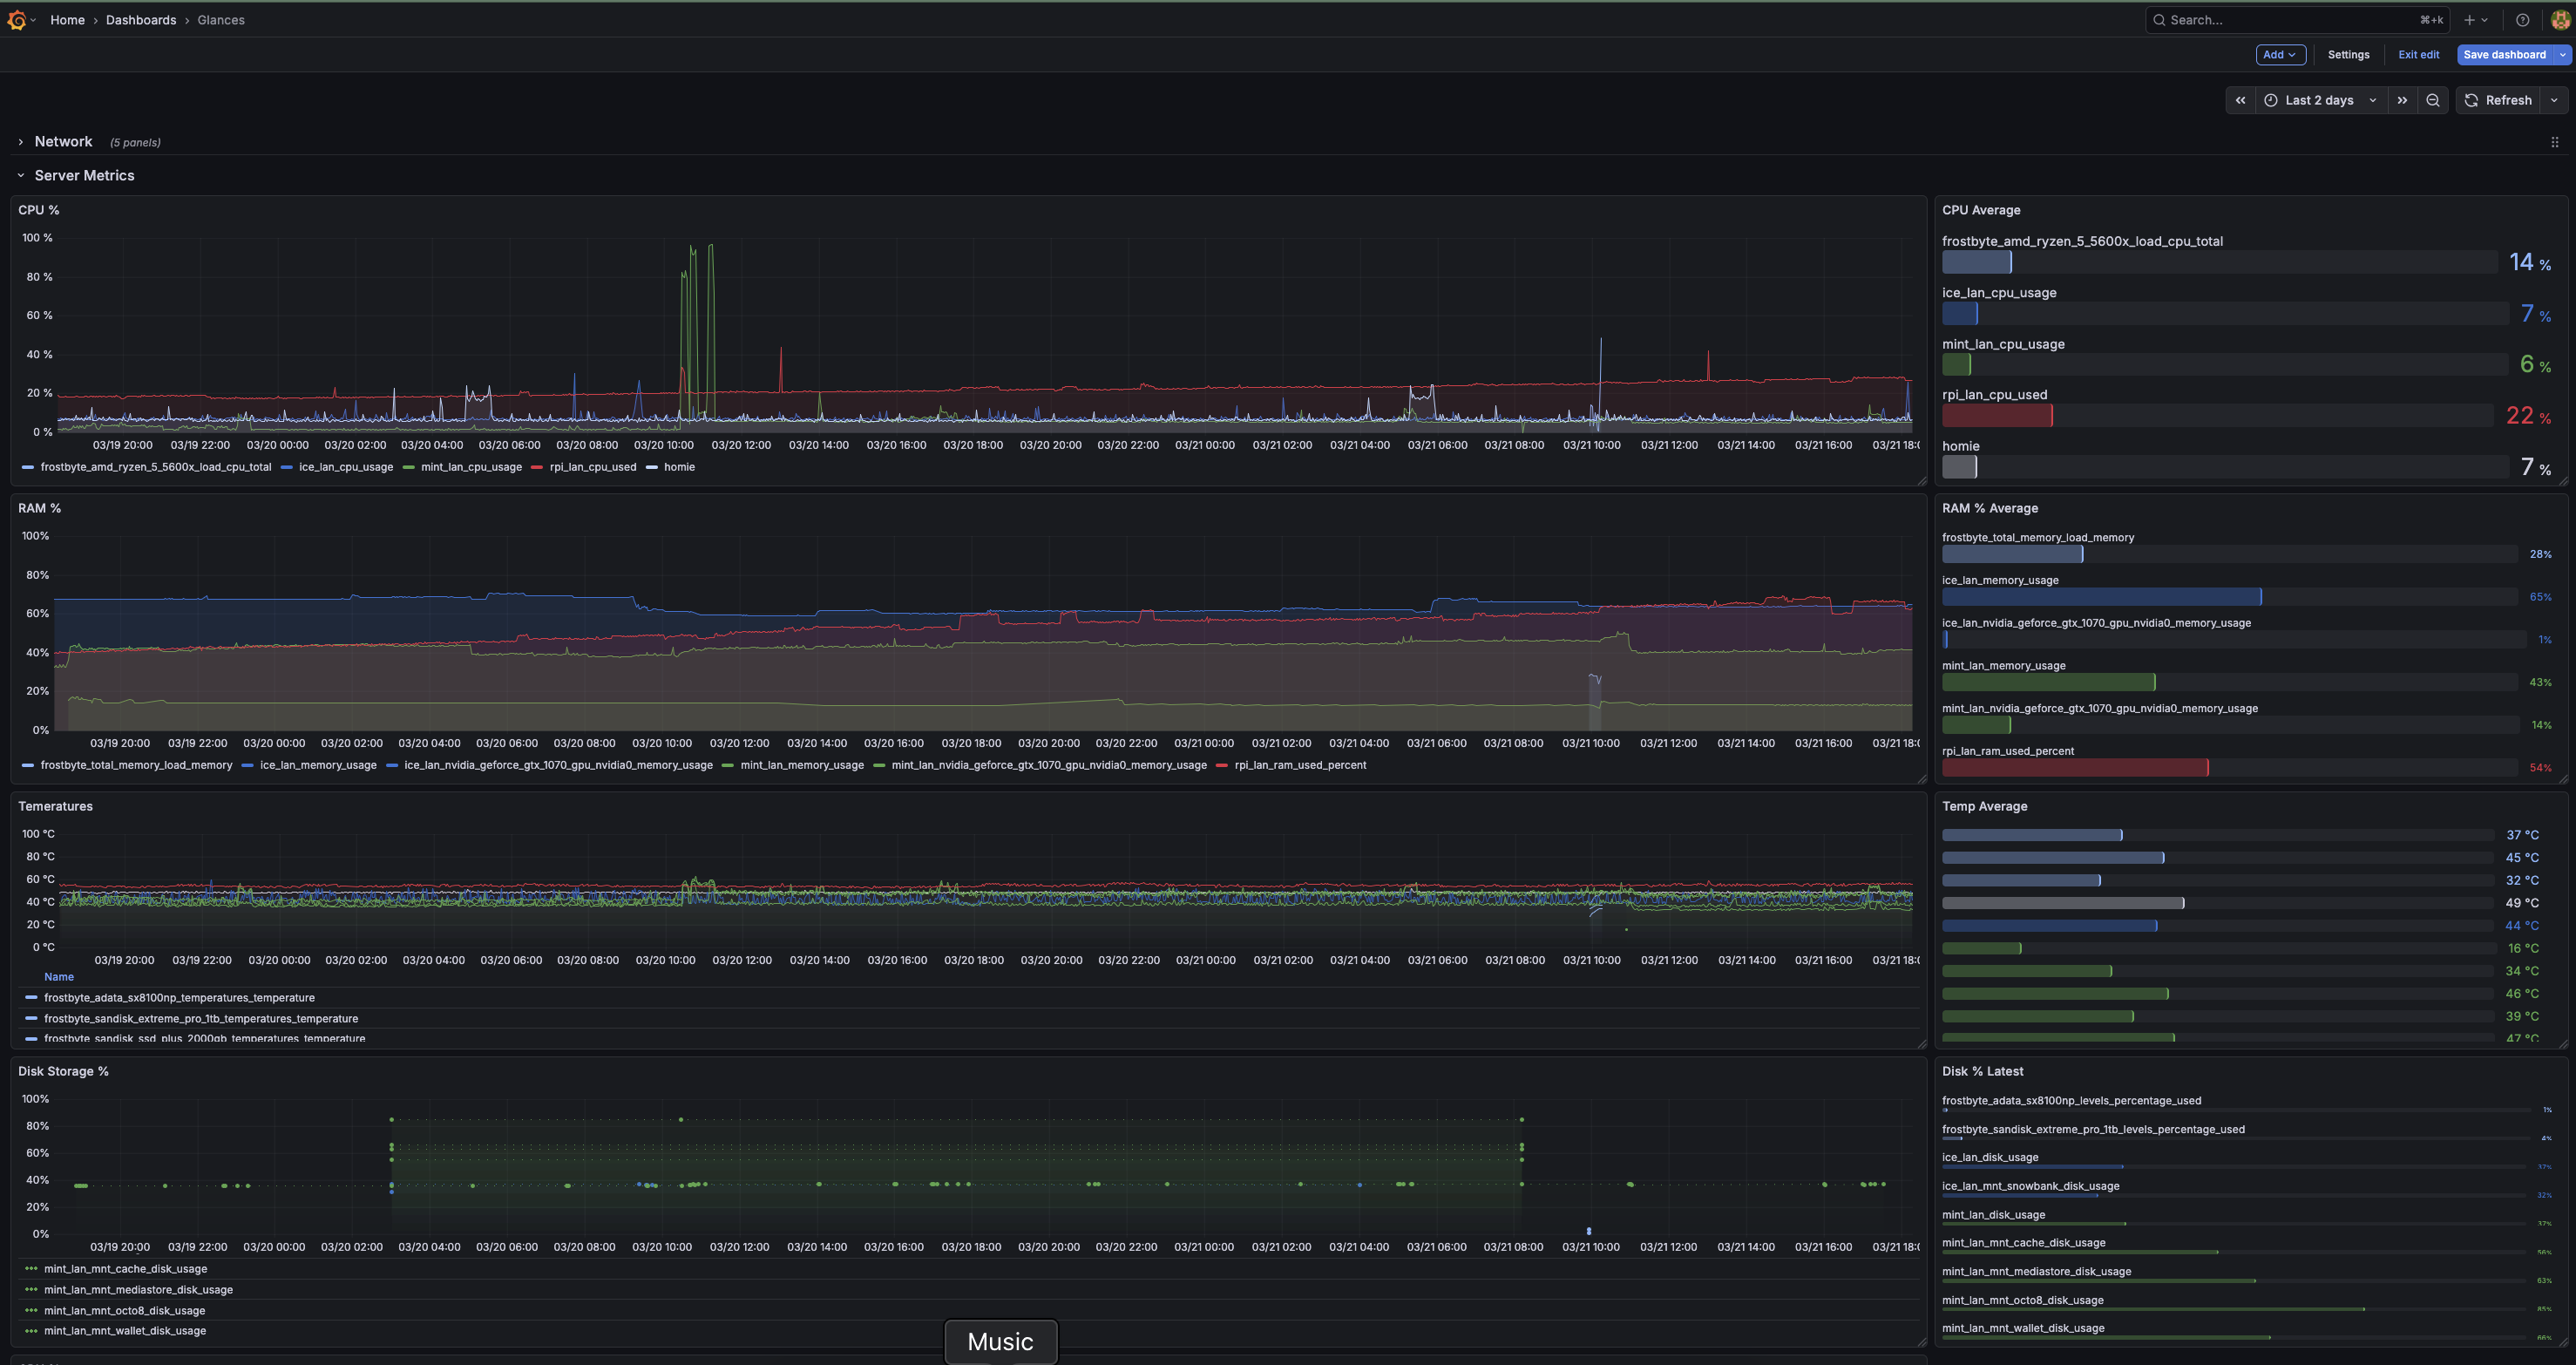
The Smart way to map your metrics
If you've spent any time adding in your devices into Grafana, you'll know how tedious it is to add in every metric in one-by-one. Here I hope to show you how to set up smart queries that automatically map your metrics in bulk as well as setting up a 2nd panel visualization that uses the data from another
This process is much easier if you setup local DNS with something like Pi-hole. You could use the device's IP Address, but later down the road you may want to switch these. A local DNS means you tie it to a name you create. Mine are as follows
frostbyte_mint_lan_ice_lan_rpi_lan_
Smart Queries
CPU Usage %
SELECT distinct("value") FROM "%" WHERE ("entity_id" =~ /.*_cpu_(used|usage|total)$/ AND "entity_id" !~ /.*_containers_cpu_usage$/) AND $timeFilter GROUP BY time($__interval), "entity_id" fill(null)
RAM Usage %
SELECT distinct("value") FROM "%" WHERE ("entity_id" =~ /.*_lan_.*(memory_used|memory_usage|ram_used_percent)$|^.*total_memory_load_memory$/) AND $timeFilter GROUP BY time($__interval), "entity_id" fill(null)
Temperature
SELECT mean("value") FROM "°C" WHERE tag =~ /.*_temperature$/) AND $timeFilter GROUP BY time($__interval), "entity_id" fill(null
Disk Storage %
SELECT distinct("value") FROM "%" WHERE ("entity_id" =~ /.*(_disk_usage|_percentage_used)$/) AND $timeFilter GROUP BY time($__interval), "entity_id" fill(null)
GPU Usage %
SELECT distinct("value") FROM "%" WHERE ("entity_id" =~ /.*_nvidia.*_processor_usage$|.*_load_gpu_core$/) AND $timeFilter GROUP BY time($__interval), "entity_id" fill(null)
CPU Load
SELECT mean("value") FROM "state" WHERE tag =~ /.*cpu_load$/) AND $timeFilter GROUP BY time($__interval), "entity_id" fill(null
Sidebar Visual
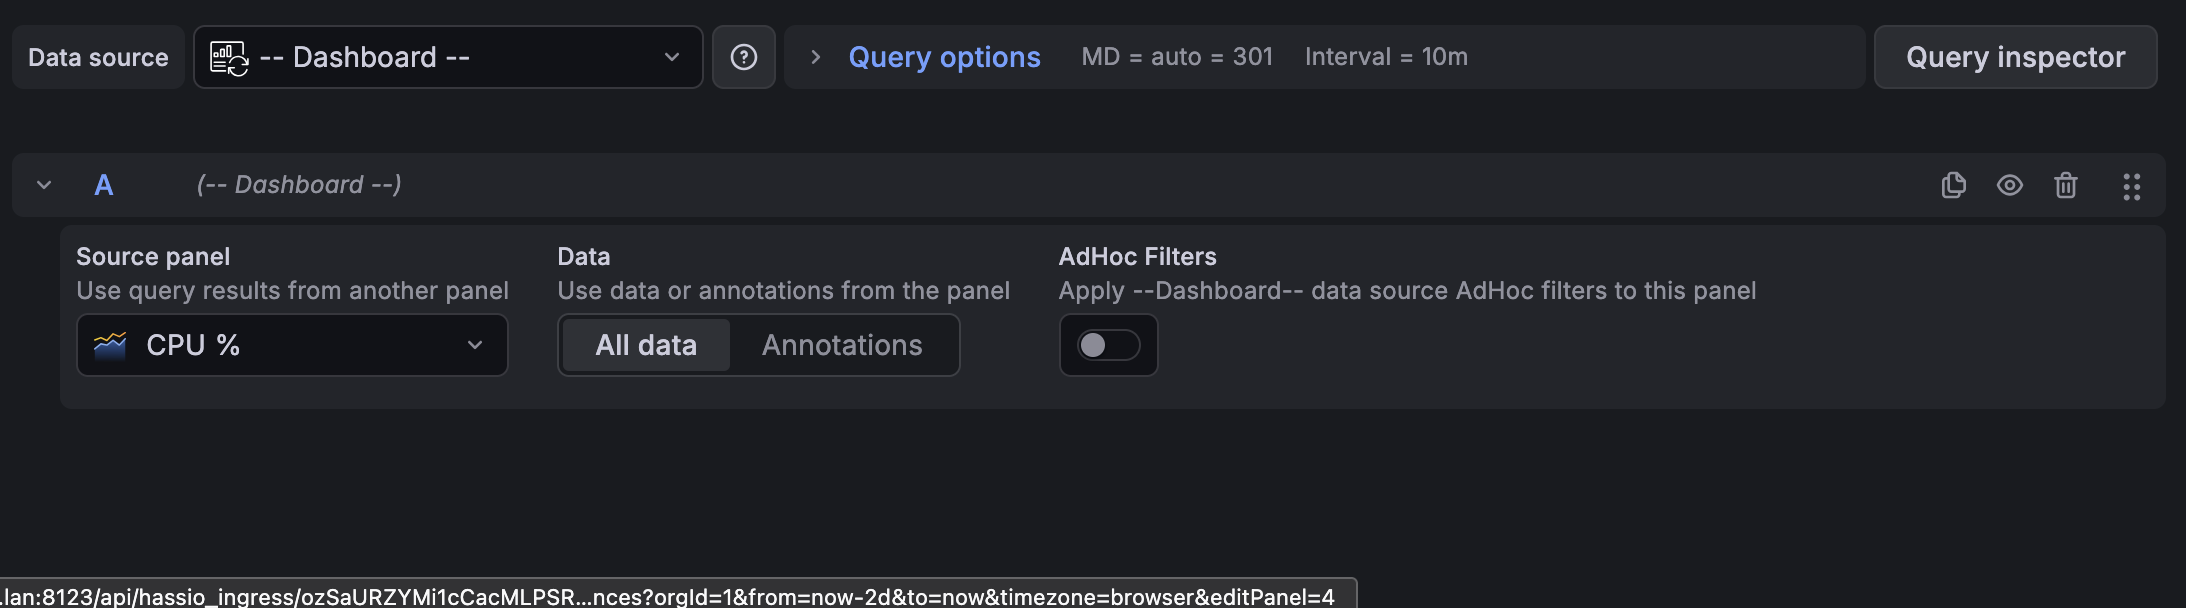
If you want to take the same data and visualize it in a different view you don't have to re-do all the queries.
Set the Data Source to -- Dashboard -- and find the existing panel. This is incredibly useful when you want to show the queries average (relative to the time range selected)
Color Coding
If your mixing and matching machines, it's nice to color code what machine is tied to which metric. You could go one by one to override the color but there is an easier way.
First go through the machine's with a Regex Match and use the machine's prefix. Then you can go into Settings > JSON Model and look for this snippet and replace with any other "overrides": []
Here is my example that color codes for machine prefix names. (this is much easier if you set Local DNS)
"overrides": [
	{
		"matcher": {
			"id": "byRegexp",
			"options": "/frostbyte_.*/"
		},
		"properties": [
			{
				"id": "color",
				"value": {
					"fixedColor": "light-blue",
					"mode": "fixed"
				}
			}
		]
	},
	{
		"matcher": {
			"id": "byRegexp",
			"options": "/mint_lan_.*/"
		},
		"properties": [
			{
				"id": "color",
				"value": {
					"fixedColor": "semi-dark-green",
					"mode": "fixed"
				}
			}
		]
	},
	{
		"matcher": {
			"id": "byRegexp",
			"options": "/ice_lan_.*/"
		},
		"properties": [
			{
				"id": "color",
				"value": {
					"fixedColor": "semi-dark-blue",
					"mode": "fixed"
				}
			}
		]
	},
	{
		"matcher": {
			"id": "byRegexp",
			"options": "/rpi_lan_.*/"
		},
		"properties": [
			{
				"id": "color",
				"value": {
					"fixedColor": "semi-dark-red",
					"mode": "fixed"
				}
			}
		]
	}
]
Visualize 1 Data set with 2 different Panels
Query > Data Source > -- Dashboard --
Home Assistant Allow Domains
The error message “origin not allowed” appears at the top left of the graphics window.
Grafana Plugin Options
plugins: []
custom_plugins: []
env_vars:
  - name: GF_SECURITY_CSRF_TRUSTED_ORIGINS
    value: home.lan ## <-- add domain here
ssl: false
certfile: fullchain.pem
keyfile: privkey.pem
environment:
  - GF_AUTH_DISABLE_LOGIN_FORM=true
  - GF_AUTH_ANONYMOUS_ENABLED=true
  - GF_AUTH_ANONYMOUS_ORG_ROLE=Admin
  - GF_SECURITY_ALLOW_EMBEDDING=true
Not sure how to add multiple domains